
Getting Started
We have finally reached a point of discussing our first cycling scenario. Starting up is exactly what it sounds, it is being at rest and getting the cyclist-cycle up to the desired riding speed. We could make this complicated by assuming we are starting on a hill, but let’s keep it simple and assume we are starting on the flats and can therefore ignore gravitational forces, with the exception of the weight contribution to rolling resistance.
Starting up Dynamics
The initial state of the cyclist-cycle is at rest and we know from Newton’s First Law, that a forward force must be exerted to get everything moving. That forward force must do two things: overcome any resistive forces and provide a sufficient excess to accelerate up to the desired riding speed.
Again, keeping things simple, we can recognize that aerodynamic drag does not really become significant until 10 mph combined speed and Headwind. So we will at first assume no headwind and that we are looking to get up to 10 mph. Our objective is therefore to estimate for a given size cyclist and cycle, what would it take.
In terms of Cycling Models, velocity is changing and this is a motion model. We are interested in the Motion Equations for a given Forward Force. The diagrams here were produced using the incremental numerical method for solving the Force Equation.
Startup Pedaling Strategies
Finally, what about how we pedal during startup. There are multiple strategies, but here are two:
- Pedaling with the same force during the startup. As speed increases, more of that force goes into dealing with resistive forces.
- Pedaling with increasing force where the increase is just sufficient to balance the increase in resistive forces. The net result would be a constant force throughout the cycle under the assumption of no resistance.
Starting Up Scenarios
Starting up involves moving from a dead stop up to a certain target speed. Here are the questions we might ask:
- If I am looking to reach a given riding speed, how much pedal force is required to reach that speed in a given length of time.
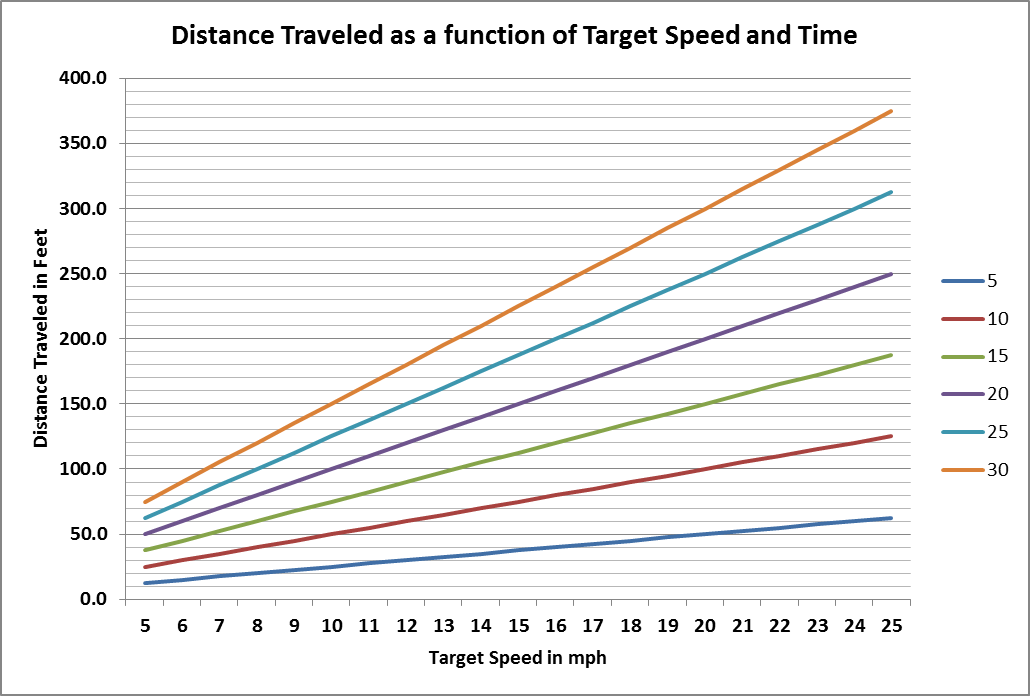
- For a given target riding speed and pedaling force, how far will I travel in the time interval.
Startups in the Absence of Resistance
The following assume that all forward force is used to accelerate from start. At low speeds, it is approximately correct. At speeds above 10 mph, the startup forces would need to account for aerodrag and therefore begin to curve up. These curves therefore represent the pure startup reqts with the understanding that drag would increase the results.
The first diagram provides the startup pedal force to achieve a given speed. The rate at which you want to get up to the speed is indicated by the various lines.

The next diagram estimates distance traveled to reach a given target speed where the various lines represent how quickly you want to reach that speed. Again, above 10 mph, aerodrag would increase the distance traveled.
Startups including Resistance
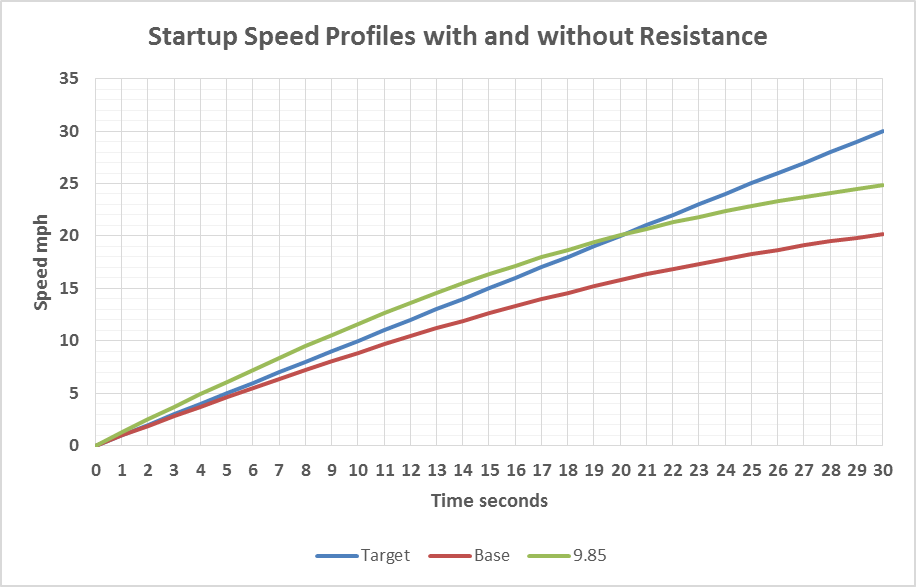
We have seen in the first Startup Scenario what the process would look like if the cyclist were consistently increasing their pedaling force to balance out the increasing resistance so that Faccel would remain constant through the startup. Now we want to consider what would happen if the cyclist simply pedaled during the startup at a constant rate. We know for a 20/20 startup, that the startup velocity profile would be a straightline increasing by 1 mph/sec.
Using our model, we plotted this along with two cases of pedaling force including resistance. The red line was plotted using 7.57 lbs which is the Faccel value needed to be maintained. As we can see, the impact of aerodynamic drag is that it takes an additional 10 second to reach the target speed because the resistive forces are reducing Faccel during the startup.
The Green line is a second startup scenario where the pedaling force was increased to 9.85 lbs. I will show you how I got that number in the next section. Just trust it was a “lucky guess.” In this one, we see that the velocity now reaches 20 mph in 20 seconds.
So these three curves indicate the startup problem in meeting a given scenario using constant pedaling, the impact of what happens when we factor in resistance (Red), and the constant pedaling force solution.
Next Topic: Sprints