
What are the fastest sprint speeds in the Tour?
Tour Stages where time is important are called either a Prologue or a TIme Trial. A Prologue is an initial stage for the initial Yellow Jersey and are less than 5 miles in length. Speeds can reach 55 kph.
On the other hand, sprints happen within stages and primarily at the end of certain sprints. These are highly tactical and in the race to the finish, can reach upwards of 65 – 70 kph, with power outages as high as 1900 Watts. In the 2017 Tour de France, approximately seven 2017 stages were anticipated to end in sprints.
What are the demands in a high speed sprint?
While it is easy to assume that ascents require the largest amount of cyclist power generation, it is actually with sprints on the flats where that occurs. It is most likely over a Tour stage that it is on flats that you will find the highest cyclist power output.

We know that aerodynamic drag will be the primarily factor in sprinting, and drag is critically dependent on whether you are riding into a head wind or with a tail wind. Let’s first examine what would be required assuming neither to ride at 70 kph (43.45 mph).
Physical Modeling of Cycling Sprinting
From our cycling model, we know that we marginally need to include rolling resistance, but must include aerodynamic drag as the key portion of our force equation. We will be interested in the resistive forces on the cyclist as well as the cyclist power output both as a function of velocity.
Sprinting without HeadTailWinds
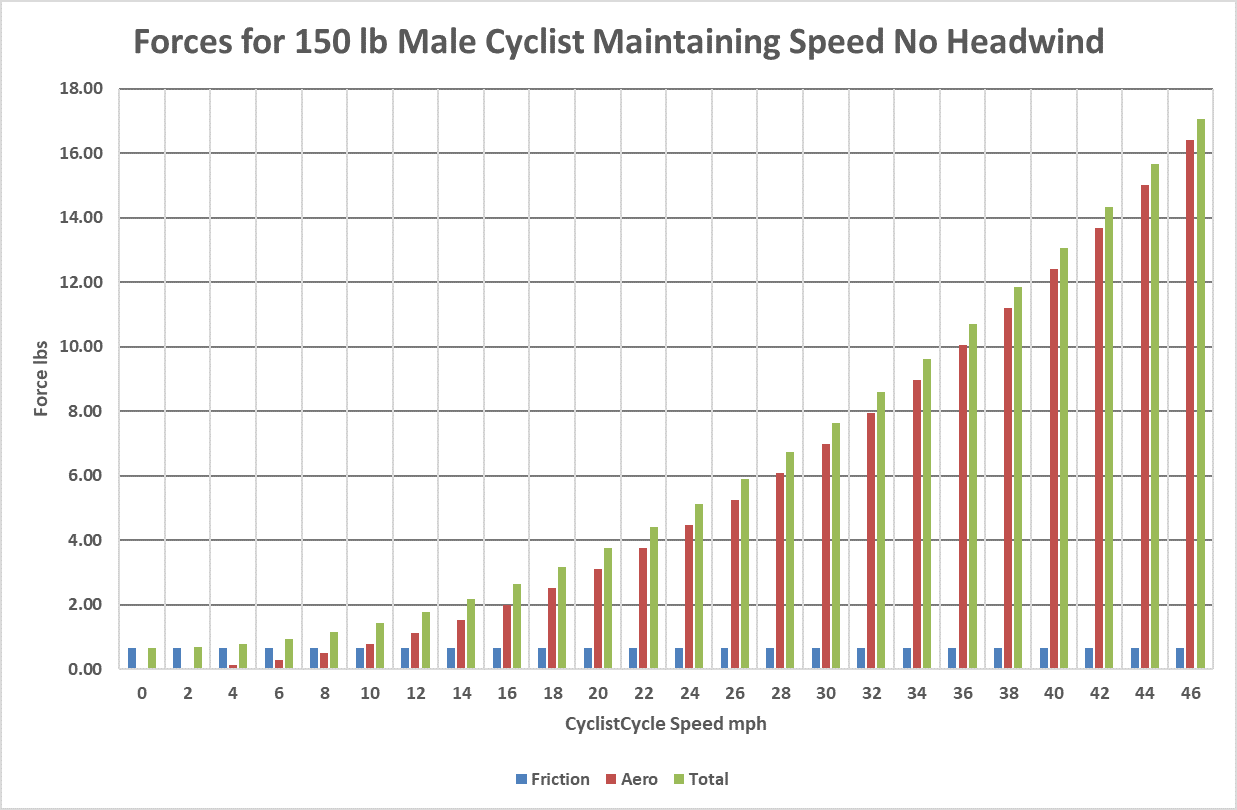
First, we want to get a feel for what are the resistive forces on a cyclist sprinting at 44 mph. Rolling Resistance is 0.66 lbs while aerodynamic drag is 15 lbs or approximately 96% of the total force.
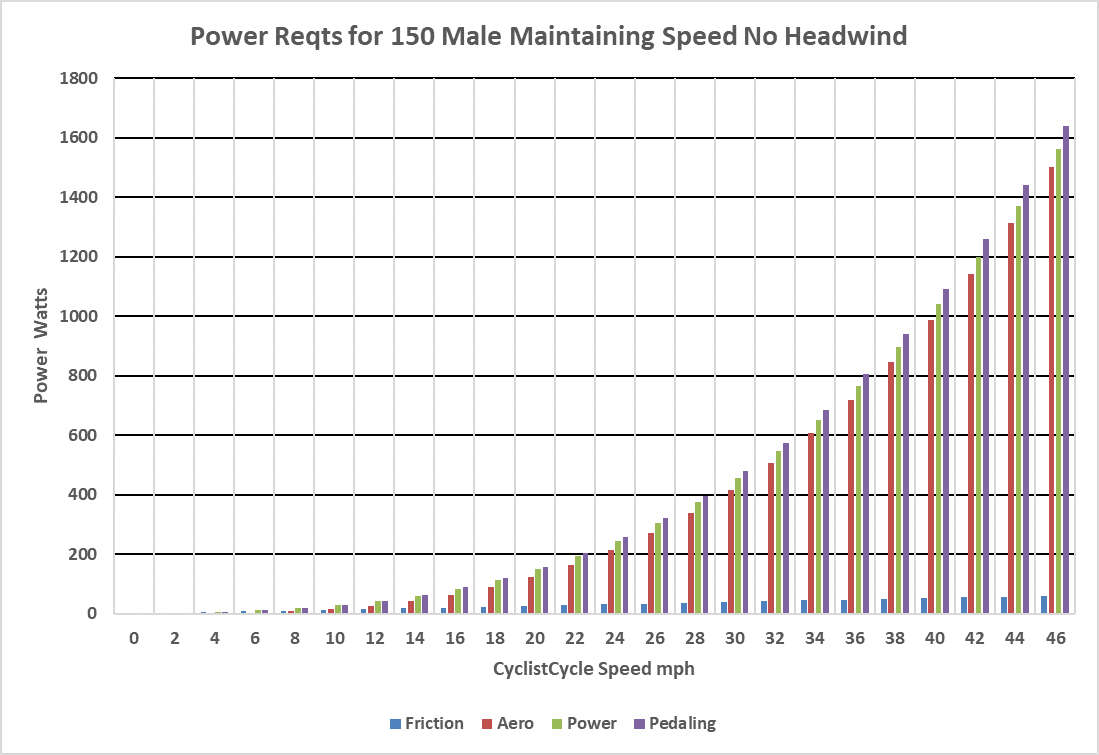
The power output needed to maintain a speed of 44 mph is displayed in the following. Here we see results consistent with the peak power output of 1440 Watts occurring at 44 mph.
Sprinting with HeadTailWinds
Aerodynamic Drag is dependent on what is referred to as the vector sum of the CyclistCycle speed and the wind speed. By this is meant the net headwind. If the net is a headwind, the effect is to impede and if it is a tailwind, it will propel.
Impact of HeadTailWinds on Resistive Forces
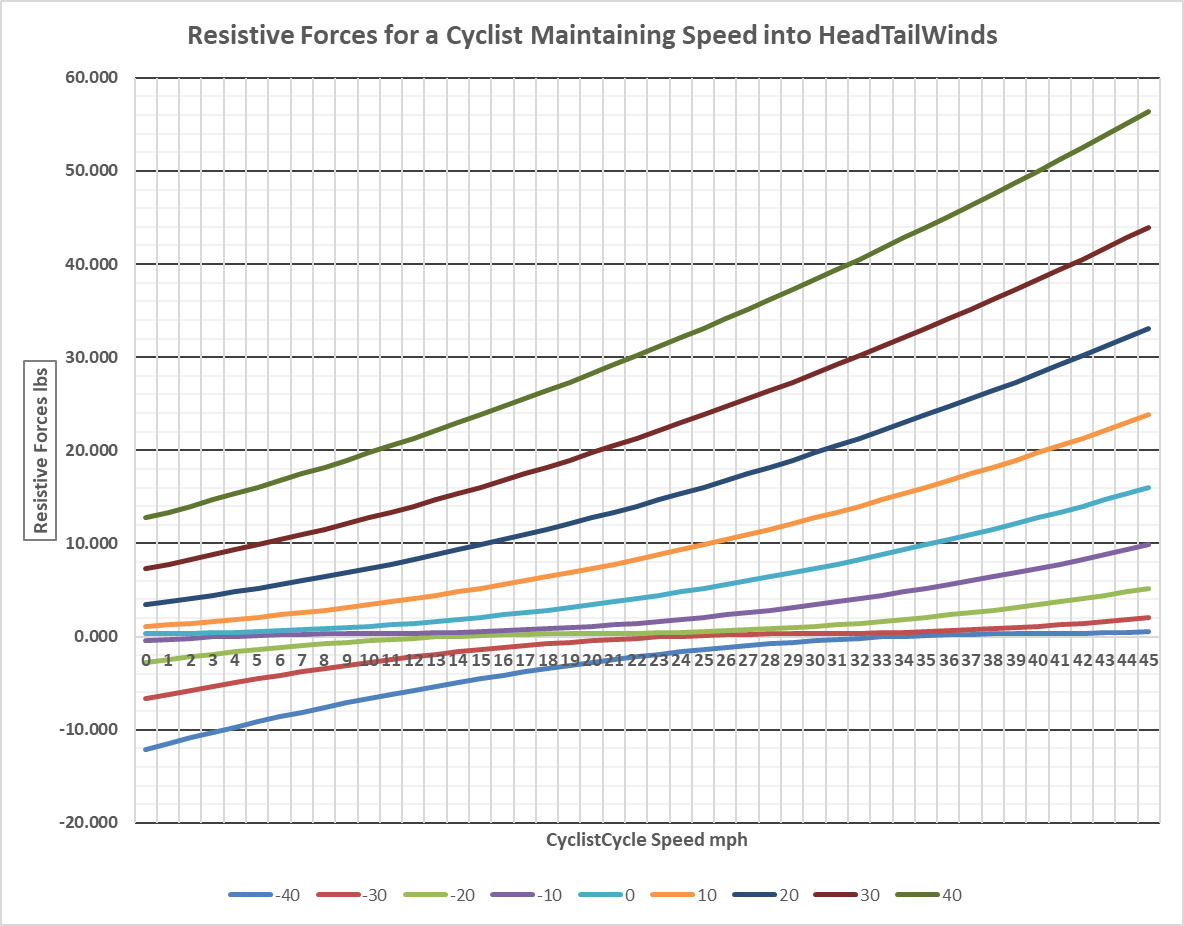
The following diagram illustrates the impact of both head and tail winds on resistive forces such as would be encountered in a sprint. We saw in the previous examples that in still air, at 44 mph the CyclistCycle was experiencing 14 lbs of resistive force. Here we see a 40 mph headwind can quadruple the resistive force, while a 40 mph tailwind can reduce the resistive forces to nearly 0 lbs.
Impact of HeadTailWinds on Pedaling Power
The following two charts parameterize force and power as a function of first headwind and then tailwinds. Looking first at headwinds, let’s remember that sprinting by elites is in the 1500 Watt range for time trials and 2000 Watts for short bursts.
You can see that headwinds can significantly impact the actual speed assuming the cyclists is operating in these ranges. Each horizontal line corresponds to a cyclist’s power generation level. Following the line across shows the range of speeds possible as a function of headwinds.

When producing a similar chart for tailwinds, we can see in comparison, there is a substantial reduction in the power required to maintain a given speed .

Next Topic: Climbing Scenarios