Category Archives: Uncategorized

How many calories does cycling burn per mile?

I thought it was 40 Calories per mile?

Recreational cyclists often ride to burn off excess pounds.  When I was a marathoner, the magic number was a 100 calories per mile. When I started cycling, I saw a magic number of 40 Calories per mile.

So I decided to test it out, and rode 800 miles in a month. I kept to long, flat rides to maintain distance. Based on the numbers, I should have lost a little over 9 lbs. At the end of the month I had lost, you guessed it, 0 pounds. Magic numbers are illusionary, and in a few calculations it will be quickly apparent why.

What is a Calorie?

The calorie originated in the study of heat rather than food, preceding the concept of joules by decades. It was defined in 1824 by Nicolas Clément and entered French and English dictionaries between 1841 and 1867.

It has two versions: calorie and Calorie. The first is the energy to raise a gram of water by a degree Celsius at a pressure of one atmosphere. The second is the kilogram calorie known as the food calorie and equal to a 1000 gram calories, and is the one you see on food packaging.

In Physics, it was many decades before heat could be explained mechanically and so the energy units were assumed to be different. When that finally happened, a calorie was determined to be equivalent to 4.1858 joules. Calories and Joules are therefore the same thing differing only by a scaling factor.

How is a calorie connected to cycling?

Cyclist effort or  work is measured in Joules. Any use of calories in discussing effort must first be preceded by an estimation of the work. Once computed in terms of Joules, it can be converted to Calories by dividing by 4185.8 Joules/Calorie.

Does 40  Calories per mile even make sense?

Once you understand the connection between Calories and effort, you see one fixed number makes no sense. You can ride a mile downhill or climb one uphill with distinctly different efforts. Each would have different Joules associated with the effort, and after the division, different Calorie counts.

Why no weight loss after 800 miles?

In the notes under Cyclist Modeling, I have a section called Burning Calories with two charts detailing the number of calories burned riding flats and making ascents. The numbers are computed by determining the number of Joules to ride against the appropriate resistive forces and dividing to get Calories. These were computed for a CyclistCyle weighing 166 lbs.

The graph below adjusts the calories burned per mile for riding flats for my weight of 180 lbs on Asphalt (0.004). It is parameterized based on riding speed and demonstrates calories burned is riding scenario dependent, not based on miles ridden. Also, 40 calories per mile would only be achieved by an Elite cycling sprinter looking to set a world record.

Calories burned for a 180 Lb cyclist riding flats. Reagan Zogby

Consider my 800 mile month. At 15 mph,  I was burning 5 calories per mile. So for 800 miles, I burned 4,000 calories or using the conversion to pounds of 3500 calories, 1.14 pounds of weight, nowhere near what I had expected.

Cycling and Weight Loss

Riding flats does not get the job done simply because you are not,  in physical terms,  “working” hard enough. You need to be riding challenging courses, the more the better.

http://www.behavioradvisor.com/Teacher-SchoolServices/HealthSupplements.html


I have never trusted magic numbers. The origin of Calories had nothing to do with physiology. Equating Calories to food and weight is simplistic when you are dealing with an energy factory as complex as the human body.


I am not a Physiologist, but here are a couple of my own beliefs about cycling and weight loss:

  • You can ride and not lose weight. Cycling needs to be part of a full health program including sensible diets and  lifestyles.
  • Avoid dieting extremes.  A man told to reduce his salt intake eliminated it, not realizing the heart needs salt. He died.
  • Consider reducing your carbohydrate intake.
  • When riding, include hills. Flats burn time not weight.
  • Time spent away from the refrigerator counts for something.
  • Exercise can reset your blood sugar levels and reduce  appetite.
  • Make your goal feeling healthy. Weight loss is like profit. It is a consequence of doing the right things.

What are cycling scenarios?

What are cycling scenarios?

When cyclists dream, they are making a legendary climb. In this blog, I highlight several scenarios of varying challenges, and in my next, I discuss how physical cycling can provide insights into how you might perform if you actually were able to make the climb.

Rating Cycling Climb Difficulties

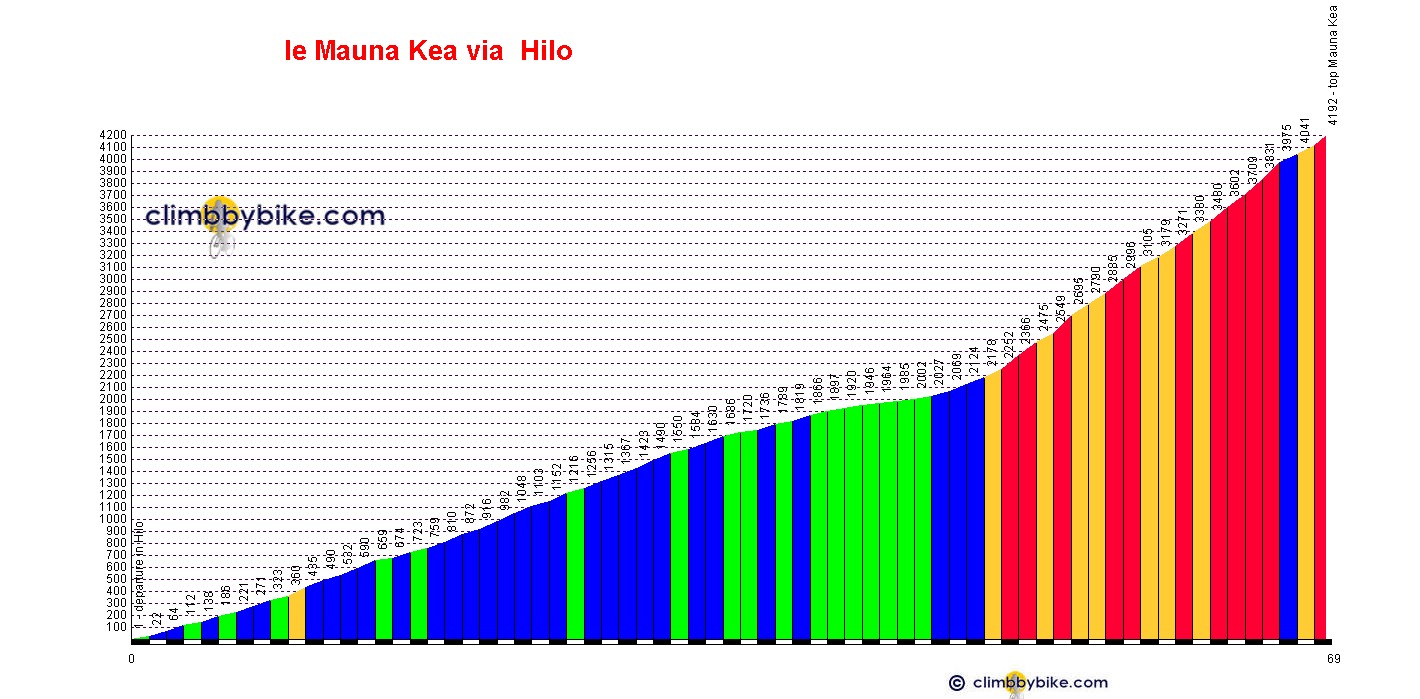
A number of websites are dedicated to identifying challenging climbs and enabling cyclists to make their ultimate road trip. The ClimbByBike website is one of those. There are several formulas used to rate difficulty and we have a page discussing their ratings. Using their own formula, they rate Le Mauna Kea on the Island of Hawaii as the most difficult in the world.

How difficult is Le Mauna Kea?

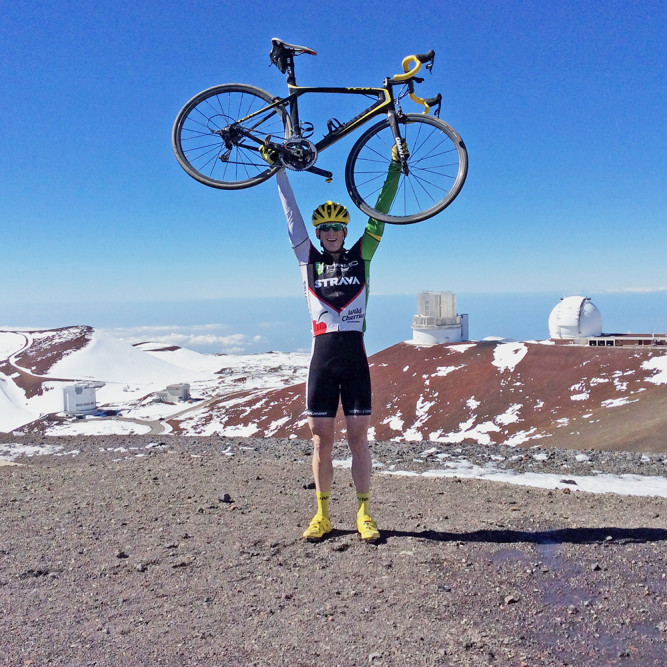
The average grade does not appear steep at 6.1%, but the length is 68.6 km and the ascent is 4191 m, or 13,750 feet. As the depiction from Veloviewer.com  shows, the average grade hides a steep ascent over the last third of the route.

Not only are the physical distances rough, but consideration the elevation and the thinness  of the air as you get to the top.

Marc Pro Strava rider Justin Rossi at the top https://blog.strava.com/conquer-a-13732-ft-kom-9372/

The Alpe d’Huze in the Tour de France

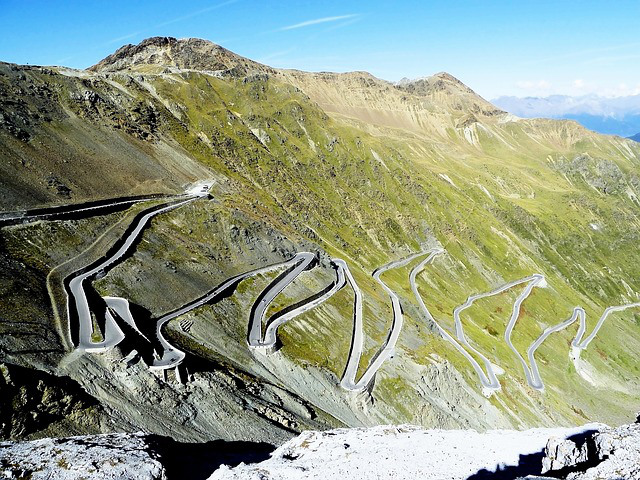
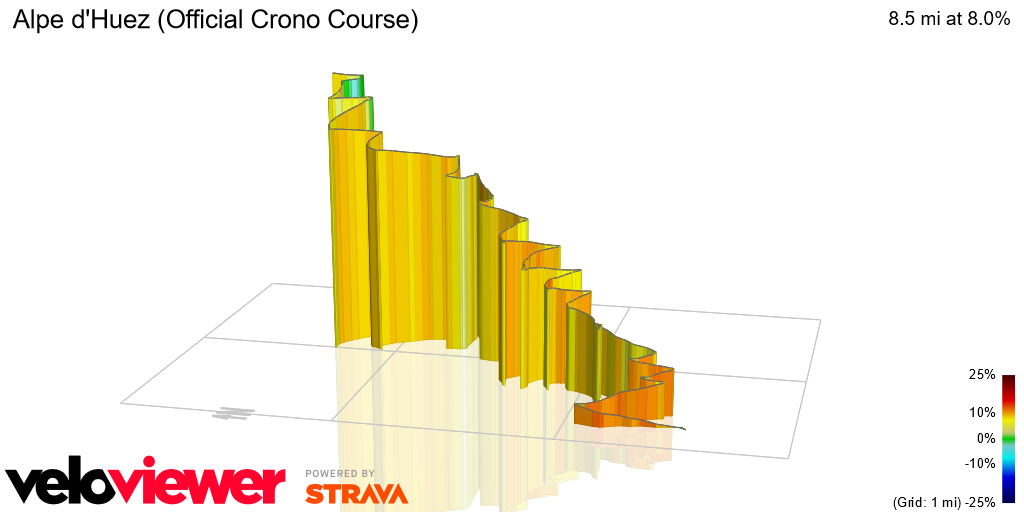
This is one of cycling’s legendary climbs. Greg Lemond even named one of his Trek models after it. From below, you see it is a strong climb over an extended distance.  It has an average grade of 8.1%, a length of 13.2 km, and an ascent of 1071 m.

Bas’ personal website https://thisbucketlist.wordpress.com

Veloviewer.com provides graphical depiction of many interesting climbs such as the one for the Alpe d’Huez.

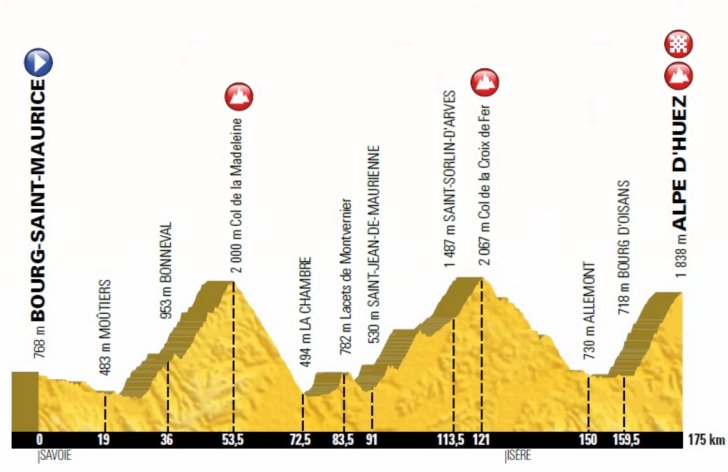
What makes this climb so legendary is its positioning in the Tour de France. It is not included every year, but it is usually the last climb in the stage, and a glance can indicate why it is so demanding.

Tour de France 2018 stage 12 https://www.cyclingstage.com/tour-de-france-2018-route/stage-12-tdf-2018/

What are the Alpe d’Huez Ascent Records?

The Ascent Record is 37 min 35 secs by Marco Pantani, with the second fastest held by Lance Armstrong one second back.  In fact the five fastest climbs are held by these two.

Marco Pantani takes the Alpe d’Huez stage at the 1997 Tour de France after the fastest ever ascent of the climb.

Unfortunately, you have to go to the fourteenth fastest ascent by Nairo Quintana 2015 Colombia at 39 mins 22 secs to find a rider  not drawn into the doping scandals of recent years.

The pressures to perform in these long distance events and compete for sponsorship were extreme on these riders. A sad consequence of this was the death Marco Pantini on 14 Feb 2014 at age 34. It was eventually concluded to have been a heart attack which could have easily been the result of long-term drug use.

The California Death Ride

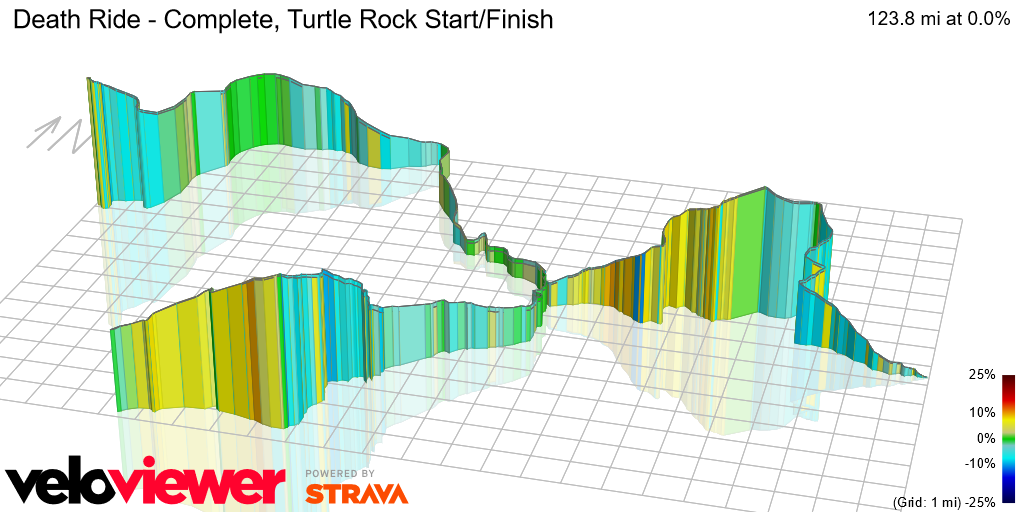
The California Death Ride in what are called the California Alps East of Sacramento and near the Nevada border is another notorious cycling challenge. It is 129 miles long and ridden at a  minimum elevation of 5500 feet. It includes five climbs with a total elevation gain of over 15,000 ft.

https://deathride.com/maps/

The VeloView of this ride shows that it begins in the center at Turtle Rock, climbs Monitor pass to the right and back to the center. Then It does the same thing with Ebbetts Pass on the lower left. Finally it makes its last climb over Carbon Pass and returns to Turtle Rock.

http://veloviewer.com/segment/682081

The Rock Store Snake Climb in Westlake Village

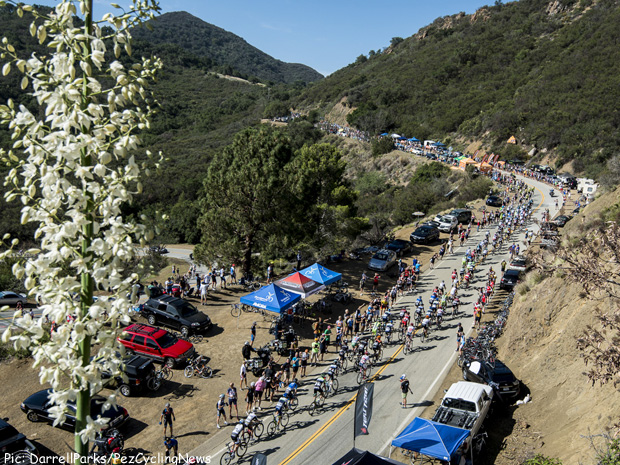
Nearby Westlake Village is a climb called the Rock Store Snake. It is frequently used as a practice route by Tour riders, and as part of a four loop ride on the last leg of the Tour de California.

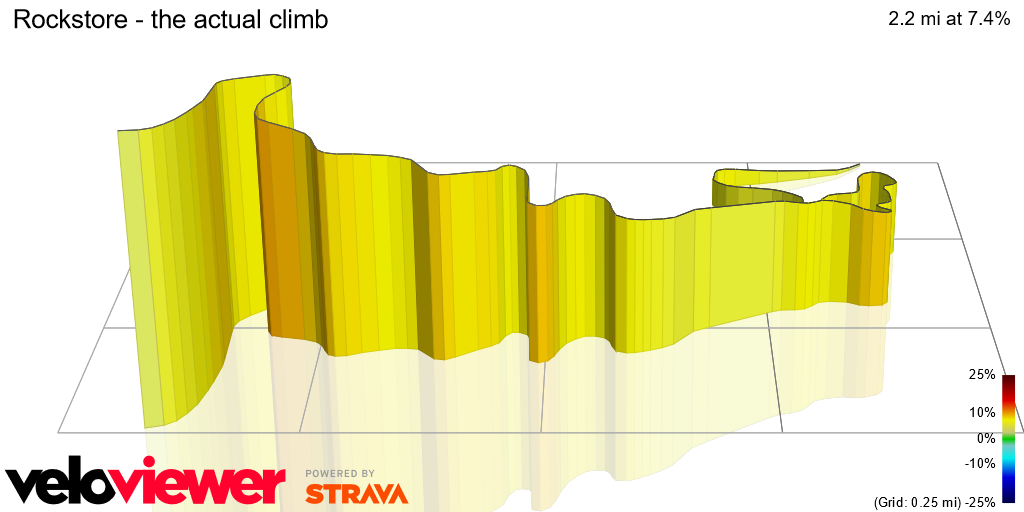
How does it compare to the Alpe d’Huez? It is 2.3 miles with an elevation gain of 875 ft.  It has an average grade of 7.3% and a max grade of 10.8%. When part of a last leg four loop ride, these numbers become 9.2 miles and 3500 ft in elevation gain. The climb stats are pretty comparable with the one significant difference that the Alpe d’Huez climb is continuous rather than broken into four loops.

I am proud to have made the climb in under 21 minutes. Of course, the tour cyclists do it under 11 minutes and I can guarantee you I would not have been only 44 minutes behind after the fourth ascent.

pezcyclingnews.com

 Determining if a climb will “eat my lunch?”

While there a lot of “pretty” graphics here, the real questions are “Can I do it?” and then “How fast could I do it?”

These are several cycling scenarios, and their many more out there.  As a cyclist, whenever you learn about a new climb, what goes through your mind is “Can I do it?” and then “How fast?”

These questions are well suited to physical calculations, and the good news is they are some of the simplest calculations associated with cycling.